 ChatGPT
 Grok
Grok
 Claude
 Perplexity
 Google AI
- 1 TL;DR SUMMARY
- 2 What is ROAS (Return on Ad Spend)?
- 3 What is ROI (Return on Investment)?
- 4 ROI vs ROAS at a Glance
- 5 How to Calculate ROAS (Step-by-Step Framework)
- Simple ROAS Calculation
- Advanced: Multi-Touch Attribution ROAS
- 6 How to Calculate ROI (Complete Profit Accounting)
- Step-by-Step ROI Calculation
- ROI Variation by Business Model
- 7 ROAS vs ROI: Key Differences Explained
- 1. What They Measure
- 2. Time Horizon
- 3. Scaling Challenges
- 8 When to Track ROAS vs ROI
- Track ROAS When:
- Track ROI When:
- Best Practice: Track Both Simultaneously
- 9 Conclusion
- 10 Frequently Asked Questions
- What’s the difference between ROAS and ROI in simple terms?
- Can you have high ROAS but low ROI?
- How often should I check ROAS vs ROI?
- Which metric is more important for my business?
- Is a 3:1 ROAS good?
TL;DR SUMMARY
ROI and ROAS measure different things—and you probably need both in 2026.
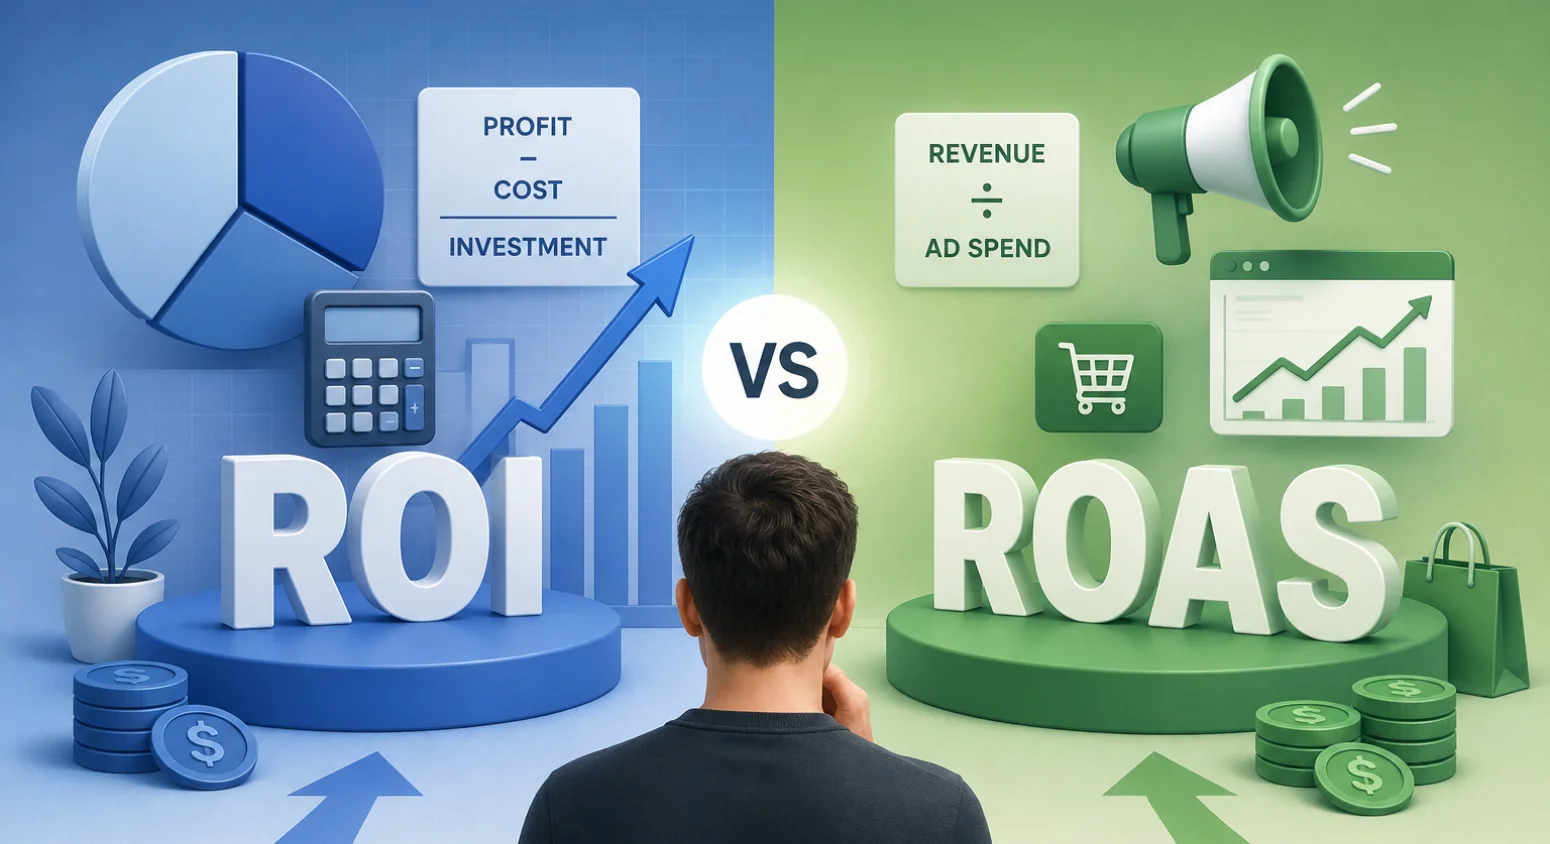
- ROAS (Return on Ad Spend) = Revenue ÷ Ad Spend. Measures ad channel efficiency alone.
- ROI (Return on Investment) = (Profit ÷ Total Investment) × 100. Measures overall campaign profitability.
- ROAS is faster (daily, real-time). ROI is more complete (includes all costs).
- High ROAS ≠ high ROI if total business costs are high.
- Best practice: Track ROAS for channel optimization; track ROI for business decisions.
2026 benchmark: 3:1 ROAS = baseline; 5:1 = excellent. Healthy ROI = 200%+.
You just spent $5,000 on paid ads and generated $20,000 in revenue. That’s a 4:1 ROAS. You should be celebrating, right?
Maybe not. That revenue doesn’t account for your product costs, team salaries, platform fees, or operational overhead. Your actual profit might be 15%—far below what you expected.
This is the ROI vs ROAS problem facing 2026 marketing teams.
Both metrics are correct. Both are useful. But they answer different questions:
- ROAS answers: “How efficiently is this ad channel converting?”
- ROI answers: “Is this investment actually profitable?”
This guide breaks down the exact differences, when to use each, and which one should drive your strategy.
What is ROAS (Return on Ad Spend)?

Return on Ad Spend (ROAS) is a marketing metric that measures revenue generated per dollar spent on advertising. It’s calculated as gross revenue divided by ad spend. ROAS focuses exclusively on ad channel efficiency and is commonly used for paid search, social ads, and display campaigns.
Formula: ROAS = Gross Revenue ÷ Ad Spend
Example: If you spend $1,000 on Facebook ads and generate $5,000 in revenue, your ROAS is 5:1 (or 500%).
What is ROI (Return on Investment)?

Return on Investment (ROI) is a profitability metric that measures how much profit you make relative to total business investment. It includes all costs—ad spend, product cost, operational expenses, team salaries. ROI provides a complete picture of campaign profitability and guides strategic business decisions.
Formula: ROI = [(Revenue – Total Costs) ÷ Total Costs] × 100Example: If revenue is $20,000 and all costs (ads, product, overhead) equal $15,000, your ROI is 33%.
ROI vs ROAS at a Glance
| Aspect | ROAS | ROI |
| Measures | Ad channel efficiency | Overall profitability |
| Includes Costs | Ad spend only | All costs (ads, product, operations, salaries) |
| Time Frame | Real-time, daily | End of month/quarter |
| Use Case | Channel optimization, ad budget allocation | Strategic decisions, business planning |
| Good Benchmark | 3:1 to 5:1 depending on industry | 200%+ for healthy business |
| Data Availability | Immediate (from ad platforms) | Delayed (requires full cost accounting) |
| Risk of Misuse | Can look good while business loses money | Can be distorted by accounting method |
| Combines with | Helps optimize ROAS | Validates ROAS sustainability |
How to Calculate ROAS (Step-by-Step Framework)
Simple ROAS Calculation
Step 1: Gather Ad Spend Data
- Pull total spend from your ad platform (Google Ads, Meta, TikTok, LinkedIn, etc.)
- Time period: daily, weekly, monthly, or campaign-based
- Example: $2,000 spent in January
Step 2: Track Revenue Attributed to Ads
- Use UTM parameters or platform tracking
- Attribute conversions to the correct channel
- Example: $8,000 in tracked revenue from paid ads
Step 3: Divide Revenue by Ad Spend
- ROAS = $8,000 ÷ $2,000 = 4:1
Interpretation: For every $1 spent, you generated $4 in revenue.
Advanced: Multi-Touch Attribution ROAS
Most businesses now use multi-touch attribution instead of last-click, recognizing that ads rarely work alone.
For example:
- Google Ads gets 40% credit
- Email retargeting gets 35% credit
- Direct visit gets 25% credit
Your ROAS will vary by attribution model. Best practice: Report both last-click (standard) and multi-touch (accurate).
Explore: EMI vs Simple Interest: What’s the Difference? (Full 2026 Guide)
How to Calculate ROI (Complete Profit Accounting)
Step-by-Step ROI Calculation
Step 1: Calculate Total Revenue
- Sum all sales from the campaign
- Example: $50,000
Step 2: List All Costs
- Ad spend: $5,000
- Cost of goods sold (COGS): $15,000
- Payment processing fees: $2,500
- Platform fees: $1,000
- Team labor (allocated): $8,000
- Tools and software: $1,500
- Total costs: $33,000
Step 3: Calculate Profit
- Profit = Revenue – Total Costs
- Profit = $50,000 – $33,000 = $17,000
Step 4: Calculate ROI Percentage
- ROI = (Profit ÷ Total Costs) × 100
- ROI = ($17,000 ÷ $33,000) × 100 = 51.5% ROI
ROI Variation by Business Model
ROI calculations differ by business type:
E-Commerce (Product-Based):
- Include COGS, shipping, returns, packaging
- Account for high operational costs
- Typical healthy ROI: 150-300%
SaaS (Subscription):
- Focus on lifetime value (LTV) vs customer acquisition cost (CAC)
- ROI measured over 12-24 months
- Typical healthy ROI: 200-500%
Digital Services (Agency/Consulting):
- COGS is labor (lower margin)
- ROI often calculated per project
- Typical healthy ROI: 100-250%
Try the IxieVerse ROI Calculator to instantly measure your investment returns, analyze profitability, and make smarter financial decisions with accurate ROI insights in seconds.
ROAS vs ROI: Key Differences Explained
1. What They Measure
ROAS = Efficiency of ad dollars
- Tells you how well your ads are converting
- Focuses only on the top of the funnel
- Answer: “Are my ads working?”
ROI = Profitability of the entire business operation
- Tells you if the business makes money
- Includes everything: product, operations, people
- Answer: “Are we actually profitable?”
2. Time Horizon
ROAS:
- Real-time or daily
- Updated continuously
- Allows rapid optimization
ROI:
- Monthly, quarterly, or annual
- Requires full cost accounting
- Takes time to calculate accurately
3. Scaling Challenges
You can have a paradox: high ROAS with low ROI.
Example:
| Metric | Value |
| Ad Spend | $10,000 |
| Revenue Generated | $50,000 |
| ROAS | 5:1 (Excellent) |
| COGS (40% of revenue) | $20,000 |
| Operational overhead (per customer) | $22,000 |
| Total costs | $42,000 |
| Profit | $8,000 |
| ROI | 19% (Poor) |
This happens when:
- You’re selling low-margin products (e-commerce, retail)
- Customer acquisition costs are high relative to profit
- You have high operational overhead
The lesson: Always validate ROAS with ROI before scaling.
Discover: How to Create UTM Links and Track Campaign Performance
When to Track ROAS vs ROI
Track ROAS When:
- Optimizing paid ad channels (daily budget decisions)
- A/B testing creatives (which ads convert better)
- Allocating budget across channels (where to spend more)
- Managing SEM or social campaigns (real-time optimization)
- Benchmarking against competitors (industry standards)
Tool: Track in Google Ads, Meta Ads Manager, or analytics dashboard in real-time.
Track ROI When:
- Evaluating campaign profitability (end-of-month decisions)
- Determining if you should scale (before doubling ad spend)
- Building annual business plans (should marketing grow?)
- Comparing channels holistically (which truly earns money?)
- Reporting to stakeholders (board, investors, executives)
Tool: Calculate in spreadsheet or BI dashboard (Tableau, Looker, Google Sheets).
Best Practice: Track Both Simultaneously
Modern marketing teams track both metrics in parallel:
- Daily focus: ROAS (optimization)
- Weekly review: ROAS trends
- Monthly analysis: ROI assessment
This allows you to optimize short-term (ROAS) while protecting long-term profitability (ROI).
Conclusion
ROAS and ROI are both right—and you need both.
- ROAS = efficiency metric for optimizing ad channels
- ROI = profitability metric for guiding business decisions
By 2026, the most sophisticated marketing teams use this framework:
- Track ROAS daily for channel optimization (which ads to scale, which to pause)
- Calculate ROI monthly for business decisions (should we increase marketing budget?)
- Monitor CAC:LTV ratio to ensure unit economics support scaling
- Use AI/automation to adjust budgets based on both metrics in real-time
- Report both to leadership, with ROAS for tactical wins and ROI for strategic alignment
Try the IxieVerse ROI Calculator to instantly measure your investment returns, analyze profitability, and make smarter financial decisions with accurate ROI insights in seconds.
Frequently Asked Questions
What’s the difference between ROAS and ROI in simple terms?
ROAS only looks at how much money your ads made. ROI looks at whether the entire business made money.
Example:
ROAS = $5 revenue per $1 spent on ads (looks good!)
ROI = After everything costs, we made $2 profit per $1 invested (the real story)
ROAS is like checking if your fishing rod catches fish. ROI is checking if you actually made money selling the fish.
Can you have high ROAS but low ROI?
Yes, and it’s more common than you’d think. This happens when:
Your products have thin margins
Your operational costs are high
Your customer lifetime value is low
You’re scaling too fast and losing efficiency
Example: E-commerce store with 5:1 ROAS but 40% COGS + 25% overhead = only 35% profit margin = low ROI.
How often should I check ROAS vs ROI?
ROAS: Daily or every few days (for real-time optimization)
ROI: Weekly, monthly, or quarterly (to validate overall profitability)
Track ROAS for tactics. Track ROI for strategy.
Which metric is more important for my business?
If you’re asking “which should I track,” the answer is both. But the priorities differ:
If scaling: ROAS first (is this channel efficient?), then ROI (can we scale sustainably?)
If optimizing: ROAS daily (how do we improve this?), ROI monthly (is it working?)
If reporting: ROI to leadership (are we making money?), ROAS to teams (what’s working?)
Is a 3:1 ROAS good?
It depends on your industry and margins.
E-commerce with 40% margins: 3:1 ROAS might yield low ROI. Need 4:1+.
SaaS with 70% margins: 3:1 ROAS is solid ROI of ~90%.
B2B services: 3:1 ROAS is acceptable. 5:1+ is strong.
Compare your ROAS to your industry benchmark, not a universal “good” number.




![50 Best Website Design Examples for Inspiration [2026]](https://ixieverse.com/wp-content/uploads/2026/08/Best-Website-Design-Examples-150x150.webp)
Add a Comment