Every financial decision boils down to one question: Is this worth it?
Whether you’re evaluating a stock purchase, a marketing campaign, a new piece of equipment, or an entire business acquisition — ROI is the metric that answers that question with a single, comparable number.
In 2026, ROI remains the most universally used performance metric in finance and business — not because it’s the most complex, but because it’s the most actionable. It turns raw profit figures into meaningful percentages that can be compared across assets, time periods, industries, and investment sizes.
This guide covers everything: the definition, the formula, real-world examples, industry benchmarks, limitations, and advanced variations like annualized ROI. Whether you’re a first-time investor, a small business owner, or a financial analyst, this is your complete 2026 reference.
Quick Answer:
Return on Investment (ROI) is a financial metric that measures how much profit or loss an investment generates relative to its cost. The formula is:
ROI = (Net Profit ÷ Cost of Investment) × 100
A positive ROI means you made money. A negative ROI means you lost money. A “good” ROI depends on the asset class — stocks historically average 7–10% annually, while digital marketing campaigns can yield 200–500%+.
- 1 What Is Return on Investment (ROI)? — Definition
- Why Does ROI Matter in 2026?
- 2 The ROI Formula — Explained Clearly
- Core Formula
- Breaking Down Each Component
- Key Rule
- 3 How to Calculate ROI — Step-by-Step
- Step 1: Identify the Total Cost of Investment
- Step 2: Calculate the Net Profit (Return)
- Step 3: Apply the ROI Formula
- Step 4: Interpret the Result
- 4 ROI Calculation Examples
- Example 1 — Stock Investment
- Example 2 — Real Estate
- Example 3 — Business Equipment
- Example 4 — Negative ROI
- 5 Annualized ROI — For Multi-Year Investments
- 6 What Is a Good ROI? — 2026 Benchmarks
- 7 ROI vs. Other Key Metrics — Comparison Table
- ROI vs. ROAS — Key Difference
- ROI vs. IRR — Key Difference
- 8 ROI in Different Contexts
- Marketing ROI
- Social Media ROI
- Real Estate ROI
- HR / Employee ROI
- 9 Limitations of ROI — What It Doesn’t Tell You
- 10 How to Improve Your ROI — 5 Actionable Strategies
- 11 Conclusion
- 12 Frequently Asked Questions
- Q1: What is Return on Investment (ROI)?
- Q2: What is the ROI formula?
- Q3: What is considered a good ROI?
- Q4: Can ROI be negative?
- Q5: What is the difference between ROI and ROAS?
- Q6: What is annualized ROI and when should I use it?
- Q7: What are the limitations of ROI?
- Q8: How is ROI different from IRR?
What Is Return on Investment (ROI)? — Definition
ROI (Return on Investment) is a financial ratio that measures the profitability of an investment relative to its cost. Expressed as a percentage, it shows how much profit or loss is generated for every dollar invested. It is one of the most widely used metrics in finance, business, and marketing decision-making.
ROI Full Form: Return on Investment ROI Type: Profitability / Efficiency Metric ROI Output: Percentage (%) ROI Formula: (Net Profit ÷ Cost of Investment) × 100
Why Does ROI Matter in 2026?
ROI is not just a finance term — it’s a universal decision-making lens.
Here’s why it remains critical:
- Comparability: ROI lets you compare a $500 marketing spend against a $500,000 real estate deal on the same scale.
- Capital allocation: Businesses and investors use ROI to direct money toward higher-performing assets.
- Performance tracking: Consistent ROI monitoring reveals whether a strategy is improving or deteriorating over time.
- Stakeholder communication: ROI is the most widely understood metric for pitching investments to executives and boards.
- Risk assessment: Comparing expected ROI vs. actual ROI helps quantify risk exposure.
In an AI-driven economy, ROI analysis is increasingly automated — but understanding the underlying math remains essential for informed judgment.
Explore: AI for Small Business: Tools, Costs & ROI Guide 2026
The ROI Formula — Explained Clearly
Core Formula
ROI = (Net Profit ÷ Cost of Investment) × 100
Or equivalently:
ROI = [(Final Value of Investment − Cost of Investment) ÷ Cost of Investment] × 100
Breaking Down Each Component
| Term | Definition |
| Net Profit | Total revenue or gain from the investment minus all associated costs |
| Cost of Investment | The total amount of money put into the investment (purchase price + fees + operational costs) |
| Final Value | The current or ending value of the investment |
| ROI % | The percentage return generated per dollar invested |
Key Rule
Always include all costs — direct and indirect. Ignoring hidden costs (fees, taxes, maintenance, time) significantly overstates ROI and leads to poor decisions.
How to Calculate ROI — Step-by-Step
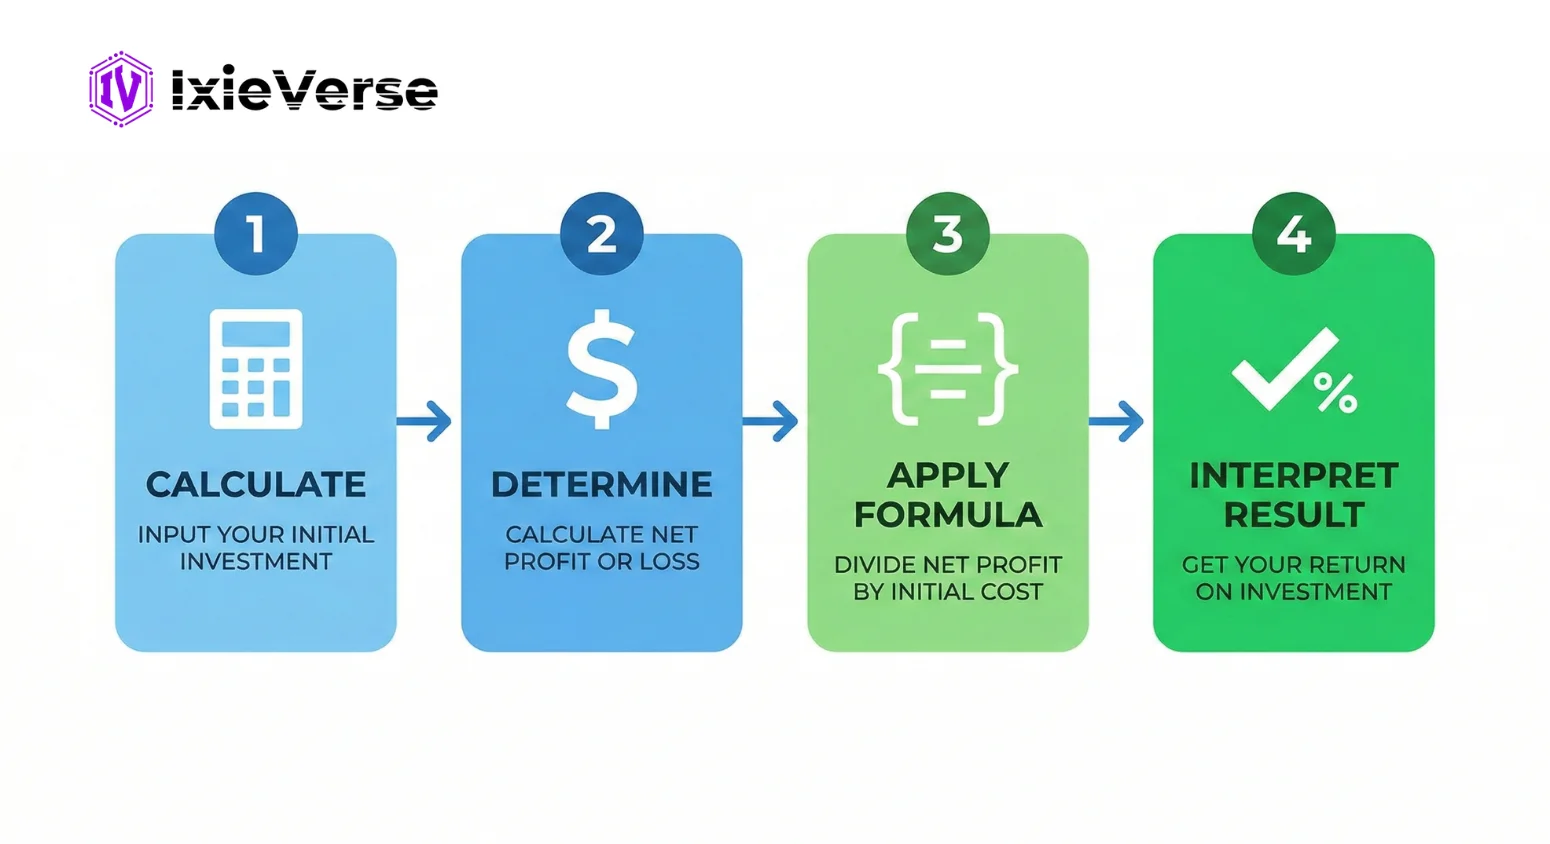
Step 1: Identify the Total Cost of Investment
Include every dollar spent: purchase price, transaction fees, installation, maintenance, labor, and indirect costs.
Example: You invest $10,000 in a digital marketing campaign, including creative, ad spend, and agency fees.
Step 2: Calculate the Net Profit (Return)
Determine the total revenue or value generated, then subtract your total investment cost.
Example: The campaign generates $35,000 in new sales revenue. Net Profit = $35,000 − $10,000 = $25,000
Step 3: Apply the ROI Formula
Divide net profit by the cost of investment, then multiply by 100.
ROI = ($25,000 ÷ $10,000) × 100 = 250%
Step 4: Interpret the Result
- ROI > 0% → Profitable investment
- ROI = 0% → Break-even
- ROI < 0% → Loss on investment
Result: Your marketing campaign delivered a 250% ROI, meaning you earned $2.50 for every $1 spent.
Stop guessing. Start knowing.
The IxieVerse ROI Calculator does the math instantly —
no spreadsheets, no formulas, no confusion.
ROI Calculation Examples
Example 1 — Stock Investment
You buy 100 shares of a stock at $50 each = $5,000 invested. One year later, the stock is worth $65/share = $6,500 final value.
ROI = [($6,500 − $5,000) ÷ $5,000] × 100 = 30%
Example 2 — Real Estate
You purchase a rental property for $300,000. After 3 years, you sell it for $390,000 and collected $30,000 in rental income.
Total return = $90,000 (price gain) + $30,000 (rent) = $120,000
ROI = ($120,000 ÷ $300,000) × 100 = 40%
Example 3 — Business Equipment
A manufacturer invests $50,000 in a new machine that increases production efficiency, generating an additional $70,000 in revenue over two years.
ROI = [($70,000 − $50,000) ÷ $50,000] × 100 = 40%
Example 4 — Negative ROI
You invest $8,000 in a product launch. It generates $5,000 in revenue.
ROI = [($5,000 − $8,000) ÷ $8,000] × 100 = −37.5%
This means you lost 37.5 cents for every dollar invested.
Stop guessing. Start knowing.
The IxieVerse ROI Calculator does the math instantly —
no spreadsheets, no formulas, no confusion.[ Try It Free — It Takes 10 Seconds ]
Annualized ROI — For Multi-Year Investments
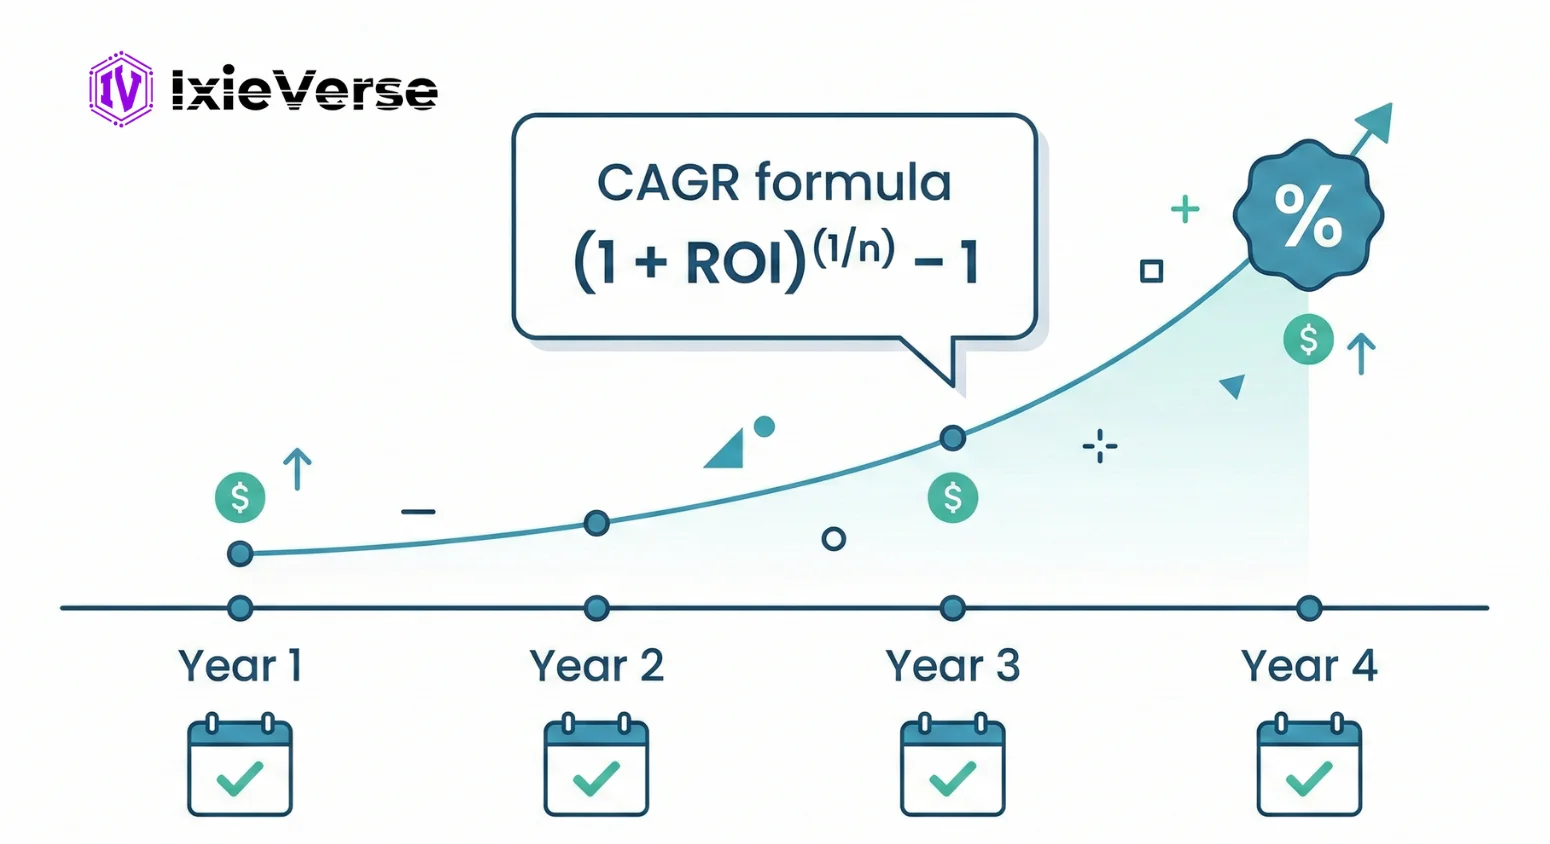
Simple ROI doesn’t account for time. A 100% ROI over 10 years is very different from a 100% ROI over 2 years.
Annualized ROI Formula (using CAGR):
Annualized ROI = [(1 + ROI)^(1/n) − 1] × 100
Where n = number of years.
Example: You invest $20,000, and after 4 years, it’s worth $35,000. Simple ROI = 75%
Annualized ROI = [(1 + 0.75)^(1/4) − 1] × 100 ≈ 15%
Use annualized ROI (or CAGR) whenever comparing investments held for different time periods.
Discover: How to Track Marketing Campaigns Like a Pro
What Is a Good ROI? — 2026 Benchmarks
There is no single “good” ROI — it depends entirely on the asset class, risk level, and time horizon.
| Investment Type | Typical ROI Benchmark |
| S&P 500 (historical avg.) | 7–10% annually |
| Real Estate | 8–12% annually |
| Small Business | 15–30%+ |
| E-commerce / Inventory | 50–150% |
| Digital Marketing (Google Ads) | 200–400%+ |
| Email Marketing | 3,600%+ (industry avg.) |
| Venture Capital / Startups | 20–30%+ (target IRR) |
| Savings Account / CDs | 4–5% (2025–2026 rates) |
Rule of thumb for 2026: Any business investment should target returns that meaningfully exceed stock market benchmarks (7–10% annually), since business investments carry higher risk and require more effort.
Discover the Ethiopian Capital Market – Capital Market Ethiopia is your gateway to the Ethiopian Stock Market
ROI vs. Other Key Metrics — Comparison Table
| Metric | Measures | Best Used For | Accounts for Time? |
| ROI | Profit relative to cost | General investments, campaigns | No (use annualized ROI) |
| ROAS | Revenue per ad dollar | Paid advertising only | No |
| IRR | Annualized return rate | Long-term, multi-cash-flow projects | Yes |
| NPV | Total value in today’s dollars | Capital budgeting | Yes |
| ROE | Return on equity capital | Evaluating company performance | No |
| Payback Period | Time to recover investment | Cash flow management | Yes |
ROI vs. ROAS — Key Difference
ROI measures profit (revenue minus all costs). ROAS measures revenue per ad dollar — it ignores costs like creative production, margins, and overhead. A campaign with 400% ROAS can still have a negative ROI if your margins are thin.
ROI vs. IRR — Key Difference
ROI is a simple ratio for single-period returns. IRR is the annualized discount rate that makes the net present value of all cash flows equal to zero — it’s far more accurate for long-term, multi-year investments with irregular cash flows.
ROI in Different Contexts
Marketing ROI
Measures the revenue generated by a marketing campaign relative to its cost.
Marketing ROI = [(Revenue Generated − Marketing Cost) ÷ Marketing Cost] × 100
In 2026, AI-powered attribution tools (like Google Analytics 4 and third-party multi-touch platforms) make marketing ROI tracking more precise than ever — including cross-channel, cross-device, and lifetime value attribution.
Social Media ROI
One of the most debated metrics in digital marketing. Beyond direct revenue, social ROI often includes brand awareness, customer lifetime value, and lead pipeline value — all of which require agreed-upon monetary values assigned to each KPI.
Real Estate ROI
For rental properties, ROI calculation should include:
- Purchase price + closing costs
- Renovation/maintenance costs
- Annual rental income
- Property taxes and insurance
- Vacancy rate adjustments
HR / Employee ROI
Companies increasingly measure ROI on hiring, training, and talent development. A well-trained sales team, for example, might generate $500,000 in incremental revenue from a $50,000 training investment — a 900% ROI.
Stop guessing. Start knowing.
The IxieVerse ROI Calculator does the math instantly —
no spreadsheets, no formulas, no confusion.
Limitations of ROI — What It Doesn’t Tell You
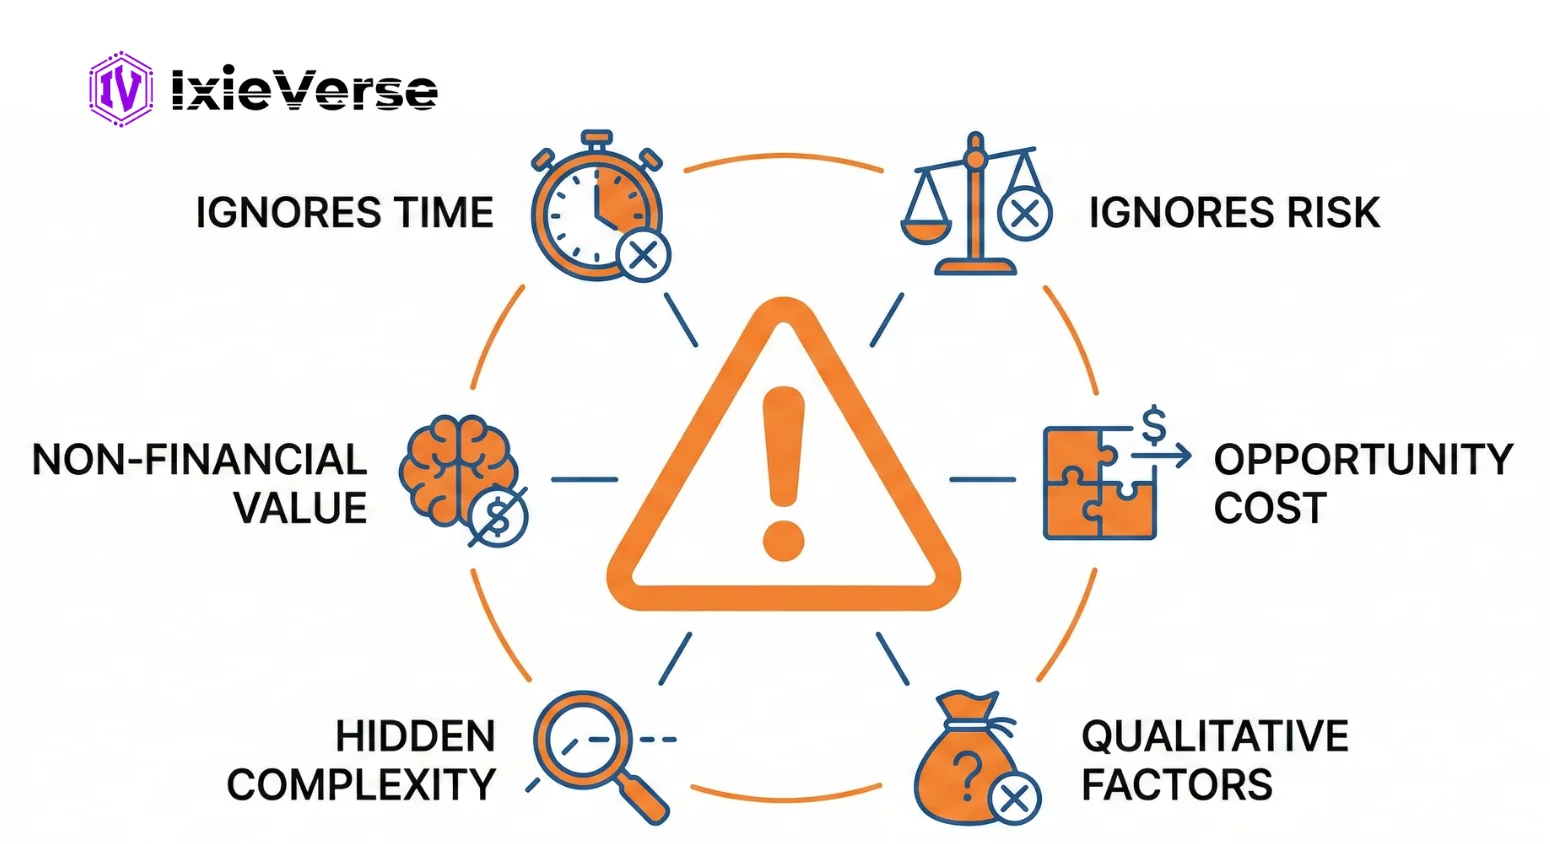
ROI is powerful, but it has real blind spots:
- It ignores time. A 50% ROI over 10 years is far less impressive than 50% in 1 year. Always pair simple ROI with annualized ROI or CAGR.
- It can be manipulated by cost definition. Choosing which costs to include (or exclude) drastically changes the result. Always be consistent and transparent.
- It ignores risk. Two investments with identical ROI may carry vastly different risk profiles.
- It doesn’t capture non-financial returns. Brand equity, employee morale, customer satisfaction, and environmental impact don’t show up in standard ROI calculations.
- It’s backward-looking. Past ROI doesn’t guarantee future performance, especially in volatile markets.
- It doesn’t account for opportunity cost. A 10% ROI looks great in isolation — but if you could have earned 20% elsewhere with the same capital, your real return was below optimal.
Also read: How to Create UTM Links and Track Campaign Performance
How to Improve Your ROI — 5 Actionable Strategies
- Reduce input costs without cutting quality. Negotiate supplier rates, automate repetitive tasks, and eliminate wasteful overhead. Lower cost of investment = higher ROI for the same output.
- Increase revenue per investment unit. Upsell, cross-sell, and improve customer lifetime value. The same campaign or asset earns a higher return without additional spend.
- Reallocate capital to higher-performing assets. Run periodic ROI audits across all investments and shift capital from low-ROI to high-ROI activities.
- Shorten the payback period. Faster revenue generation means the same ROI is achieved in less time — dramatically improving annualized ROI.
- Factor in all costs from day one. Underestimating costs leads to ROI surprises. Build conservative forecasts that include indirect costs, taxes, and depreciation.
Conclusion
ROI is the financial world’s universal translator — it converts dollars, time, and effort into a single, comparable number.
Knowing how to calculate ROI correctly isn’t just an accounting skill. It’s a strategic superpower. It helps you allocate capital with confidence, cut underperforming investments faster, and make the case for high-return opportunities to any stakeholder.
In 2026, as AI tools increasingly automate ROI tracking and reporting, the investors and business leaders who understand the mechanics behind the metric will be the ones who use it most wisely — and avoid the blind spots that raw automation can miss.
Start measuring ROI on every investment you make. Then measure it again. Over time, the pattern of where your returns concentrate will be the clearest guide to your best financial future.
Frequently Asked Questions
Q1: What is Return on Investment (ROI)?
Return on Investment (ROI) is a financial metric that measures the profit or loss of an investment as a percentage of its cost. It uses the formula: ROI = (Net Profit ÷ Cost of Investment) × 100. It is used across investing, business, and marketing to evaluate performance and compare options.
Q2: What is the ROI formula?
The standard ROI formula is: ROI = (Net Profit ÷ Cost of Investment) × 100. An alternative version is: ROI = [(Final Value − Initial Cost) ÷ Initial Cost] × 100. Both yield the same result when costs and returns are calculated correctly.
Q3: What is considered a good ROI?
A “good” ROI depends on the asset class. Stock market investments historically average 7–10% annually. Small businesses typically target 15–30%+. Digital marketing campaigns often achieve 200–500%+. Any ROI that exceeds your industry benchmark and compensates for the risk taken is generally considered good.
Q4: Can ROI be negative?
Yes. A negative ROI means the investment lost money. For example, investing $10,000 and recovering only $7,000 produces an ROI of −30%. Negative ROI is not always a failure — sometimes it reflects early-stage investments, macroeconomic events, or costs that will generate long-term returns.
Q5: What is the difference between ROI and ROAS?
ROI (Return on Investment) measures profit relative to total investment cost. ROAS (Return on Ad Spend) measures revenue generated per dollar of ad spend only. ROAS does not account for production costs, margins, or overhead — making ROI a more complete profitability measure for most business decisions.
Q6: What is annualized ROI and when should I use it?
Annualized ROI adjusts returns to a per-year basis using CAGR: [(1 + ROI)^(1/n) − 1] × 100, where n = years. Use it when comparing investments held for different time periods. A 75% ROI over 4 years equals approximately 15% annualized — very different from 75% in one year.
Q7: What are the limitations of ROI?
ROI’s main limitations include: it ignores time (a 50% ROI over 10 years ≠ 50% in 1 year); it doesn’t account for risk; it excludes non-financial returns like brand value; it depends on how costs are defined; and it doesn’t reflect opportunity cost. For multi-year investments, IRR or NPV is often more accurate.
Q8: How is ROI different from IRR?
ROI is a simple ratio for single-period returns. IRR (Internal Rate of Return) is the annualized rate of return for investments with multiple cash flows over time, accounting for the time value of money. IRR is preferred for evaluating long-term capital investments, while ROI is best for quick, single-period comparisons.


Add a Comment